Statistics on Skateboarder Ages Over The Years
Posted on Thursday, January 31, 2013. Photo by Rob Meronek.
Tags:
[Nerdsday Thursday]
[Statistics]
Related Article: Statistics on Skateboarder Ages Over The Years
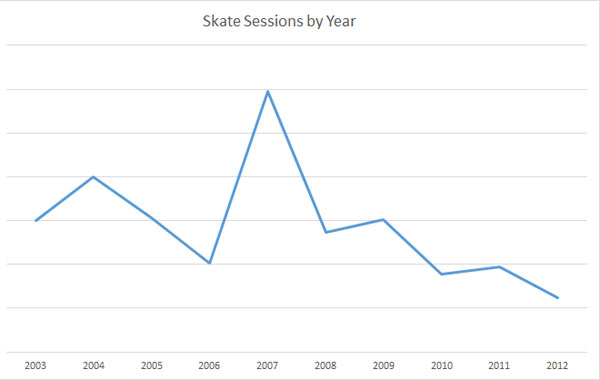
So I pulled out three years in the above charts to compare, which naturally makes you ask the question of how skate sessions year by year have looked. Once again, I can't give you the total numbers themselves, but I can show you the line graph representing the change. I hope the downward trend is just us and not skateboarding overall. I'd like to think it's all the parks opening up around here being built by local cities. Don't worry about us business-wise, though. We are very diversified with everything we do here, especially with all these events we put on. Plus, when there's more skateboarders in the area, our retail benefits of course, although we have felt the dent from the big chain skate shops I think. Thanks for checking out my nerdy numbers analysis. I'm going to try to do more of these on all kinds of other categories and topics I record data about. Signing off in the words of Jim Thiebaud, "thank you skateboarding."

Comments
Post Tags
The What's Up Column at SPoT has been going for over a decade now. Check out some random posts:- Rants
- Damn Am
- Boards for Bros
- Porpe's POV
- SPoT On
- Art Shows
- DailyBS
- General Ruckus
- Pat Stiener
- Tourist Missions
- Flooding
- Clash of the Crews
- Sales
- Demos
- Black Friday
- Public Service Announcements
- Franks for Nothing
- 10 Tricks and Two Cents
- Grip Tape Ball
- Vert
- The Bricks
- All Ages Contests
- Tampa Am
- Course Construction
- Meronek's Cell Phone Edits


