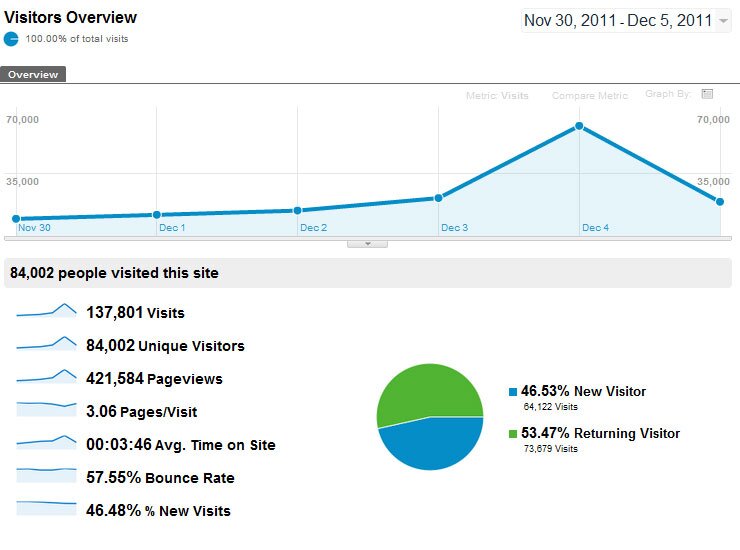
Skatepark of Tampa.com Traffic Stats:Tampa Am 2011
Posted
on Thursday, December 08, 2011.
Photo by Google Analytics.
In the time period from Thursday through Monday during Tampa Am, there were 137,801 visitors with 84,002 of them being unique. 20,762 (15%) of these were from a mobile device. Chrome was the most popular browser at 29% followed by Safari at 24%, Firefox at 21%, and Internet Explorer at 16%. 54% of the traffic was from the US with the rest of the traffic nearly evenly spread between Brazil, Canada, France, Columbia, Germany, Belgium, Norway, Chile, and the UK. Statistics from the webcast include:
- 1,357,035 minutes streamed.
- 275,995 total webstream requests.
- 12.345 terabytes were streamed. Maybe we should start a donations page for our bandwidth bill. For comparison, Tampa Pro streamed 6.6 terabytes. We nearly doubled traffic with Tampa Am's webcast after we actually put effort into promoting this time.
- 4,682 maximum simultaneous viewers.
- As far as average viewer time for webcasts, our host tells us that anything over 20 minutes is good, 30 minutes is great, and over an hour is amazing. Our average viewer time was over an hour so thanks everyone for staying tuned in the whole time.
- The number of Likes on our Facebook page went from 59,100 at noon on Sunday to over 62,500 when the webcast was done at 6pm.

